
The S&P 500 Has 29 Million Employees. They're Not Where You Think.
I created an infographic showing how many people some of the world's biggest corporations employ, and I was immediately struck by just how empty it looked.
I started with my S&P 500 market cap visualisation, where each company is represented by a sphere whose size is proportional to its market cap, essentially what the stock market thinks the company is worth.
Then I decided to add people.
I put little stick figures on these corporate planets, with each figure representing 10,000 employees. I had to make the figures pretty tiny to fit everyone into companies like Cognizant, which employs hundreds of thousands of people.
The problem is that when you look at the enormous planet that is Nvidia, a $5.2 trillion company, you have to zoom right in to find its four tiny stick figures.
That's right. Nvidia, one of the most valuable companies in the world, employs just 42,000 people. That's roughly $124 million of market value for every employee.
I thought that was fascinating, so I started looking at the other companies.
It turns out Nvidia isn't even the most extreme example.
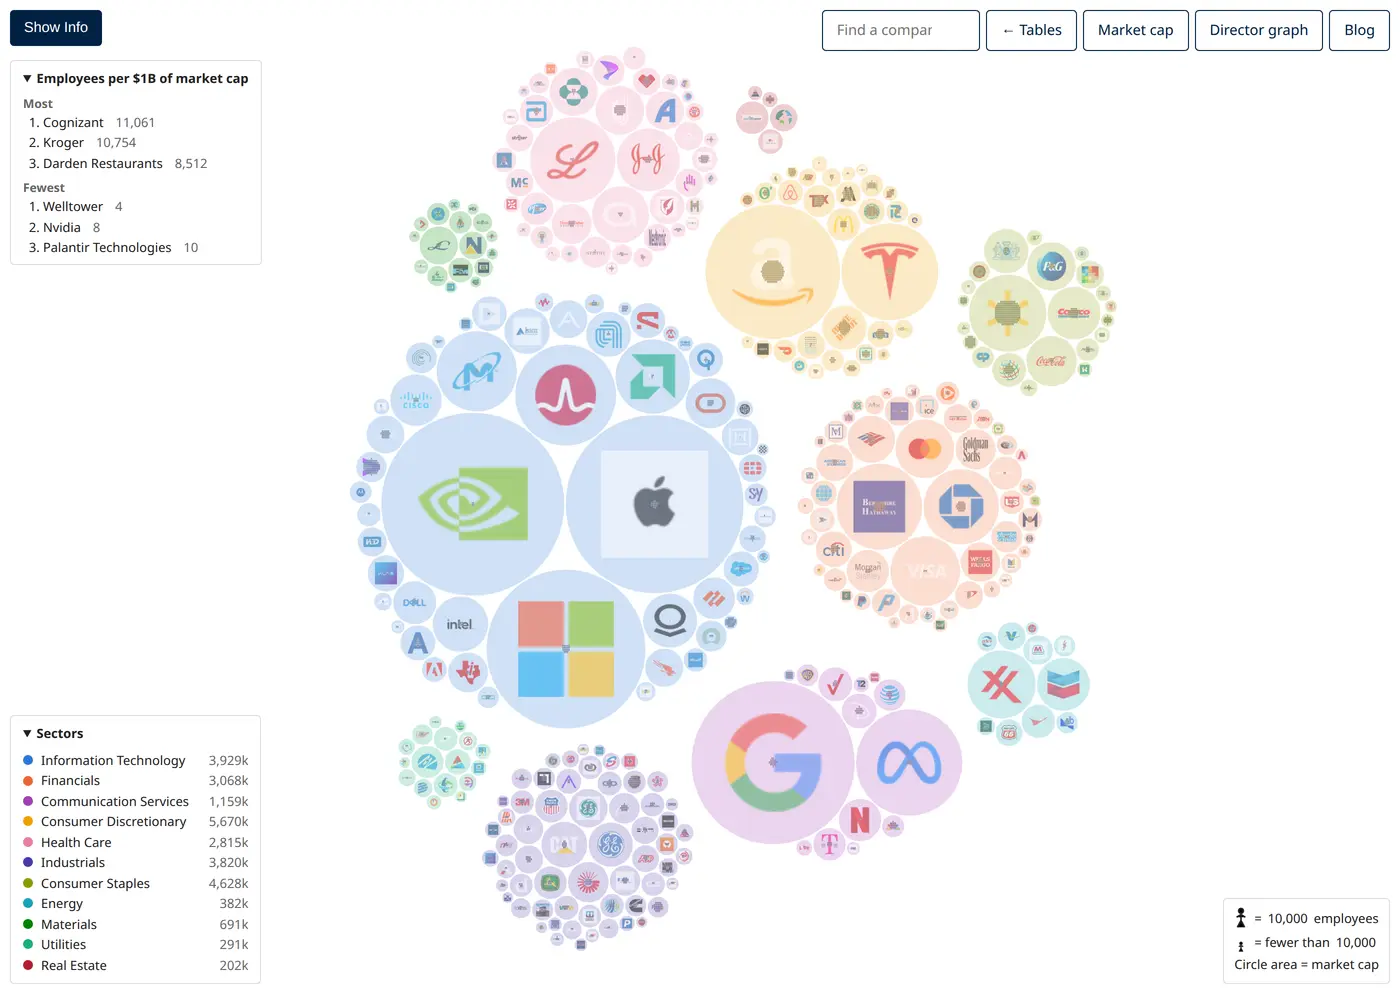
Nvidia: $124 million per employee
Let's start with Nvidia.
At $5.2 trillion, it's the biggest sphere on the entire chart. Yet inside that enormous sphere are just four tiny figures representing its 42,000 employees.
$5,200,000,000,000 divided by 42,000 people. That's roughly $124 million per employee.
Obviously, that doesn't mean each employee generates $124 million in revenue or profit. Market cap is what investors value the whole business at, including its technology, intellectual property, future earnings and everything else.
But it's still an extraordinary number.
And Nvidia isn't alone. Broadcom has just 21 employees for every $1 billion of market cap, while Apple has 30.
These are some of the most valuable companies on Earth, and their enormous spheres look practically deserted.
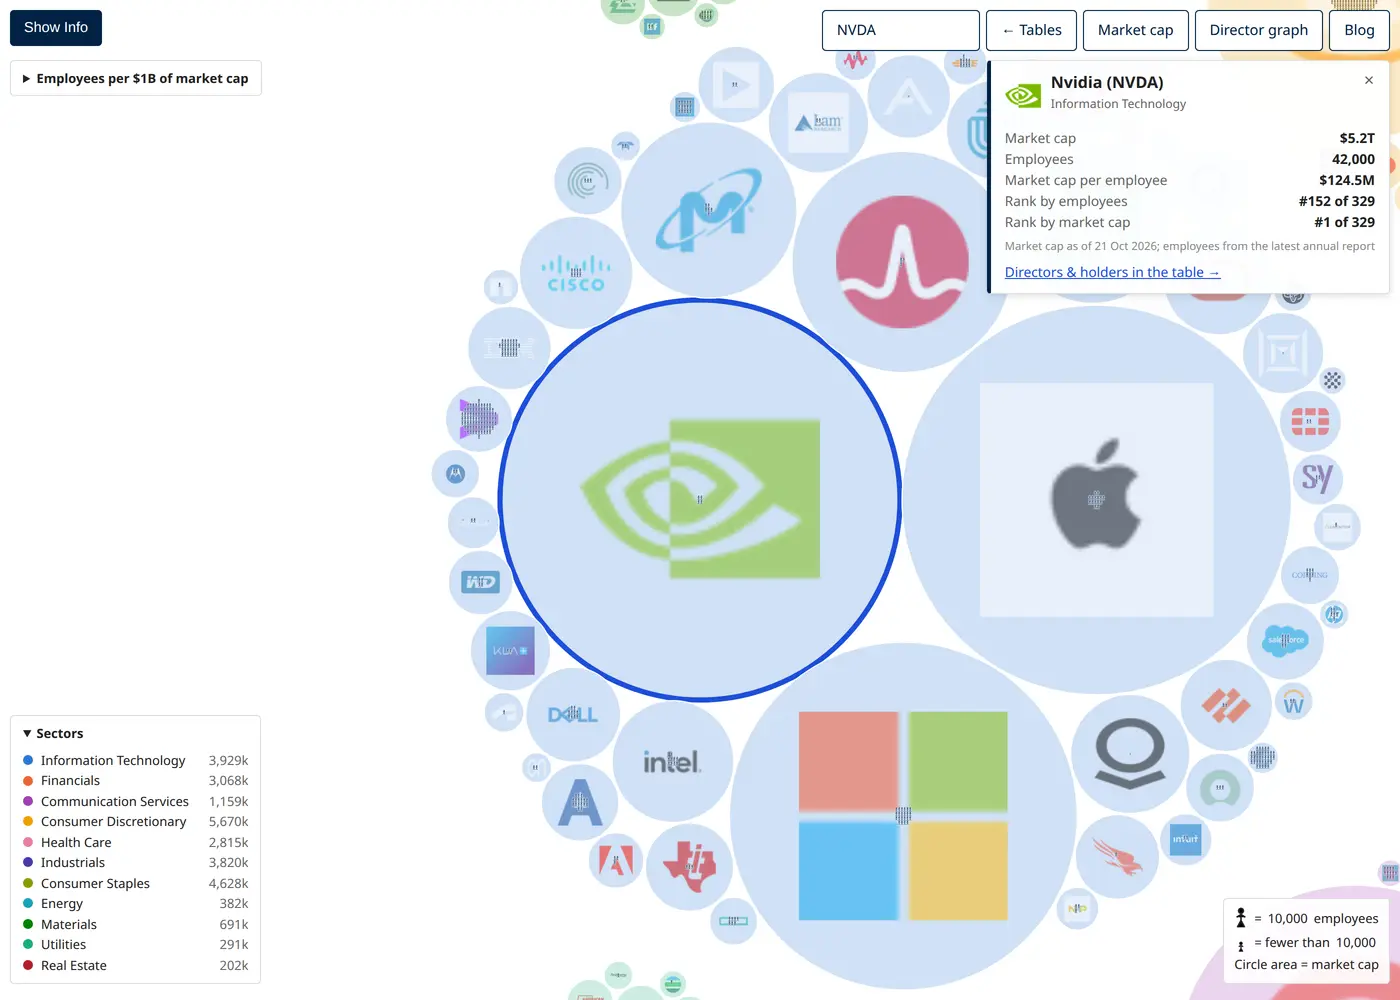
Welltower: $242 million per employee?!
I thought Nvidia's numbers were astonishing. Then I came across Welltower.
Welltower is a healthcare property company worth around $172 billion.
It employs just 712 people.
That's approximately $242 million of market cap per employee. Nearly twice Nvidia's already enormous figure.
It's worth remembering what Welltower actually does. It invests in healthcare properties, including senior housing and medical facilities. It doesn't directly employ everyone working inside those buildings. Those properties are operated by other businesses, with their own employees.
Still, it's remarkable that a company with fewer than a thousand direct employees can be valued at $172 billion.
Then there's Palantir.
Palantir is a software company worth approximately $463 billion, employing just 4,401 people. That's another $105 million of market cap per employee.
To put these three companies side by side:
| Company | Market cap | Employees | Market cap per employee |
|---|---|---|---|
| Welltower | $172B | 712 | $241.6M |
| Nvidia | $5.2T | 42,000 | ~$124M |
| Palantir | $463B | 4,401 | $105.2M |
Three completely different businesses: property, semiconductors and software.
Yet all three have enormous valuations relative to the number of people they employ directly.
Of course, with one stick figure representing 10,000 employees, Welltower and Palantir don't even have enough people for a single full figure, so they each get one half-size figure.
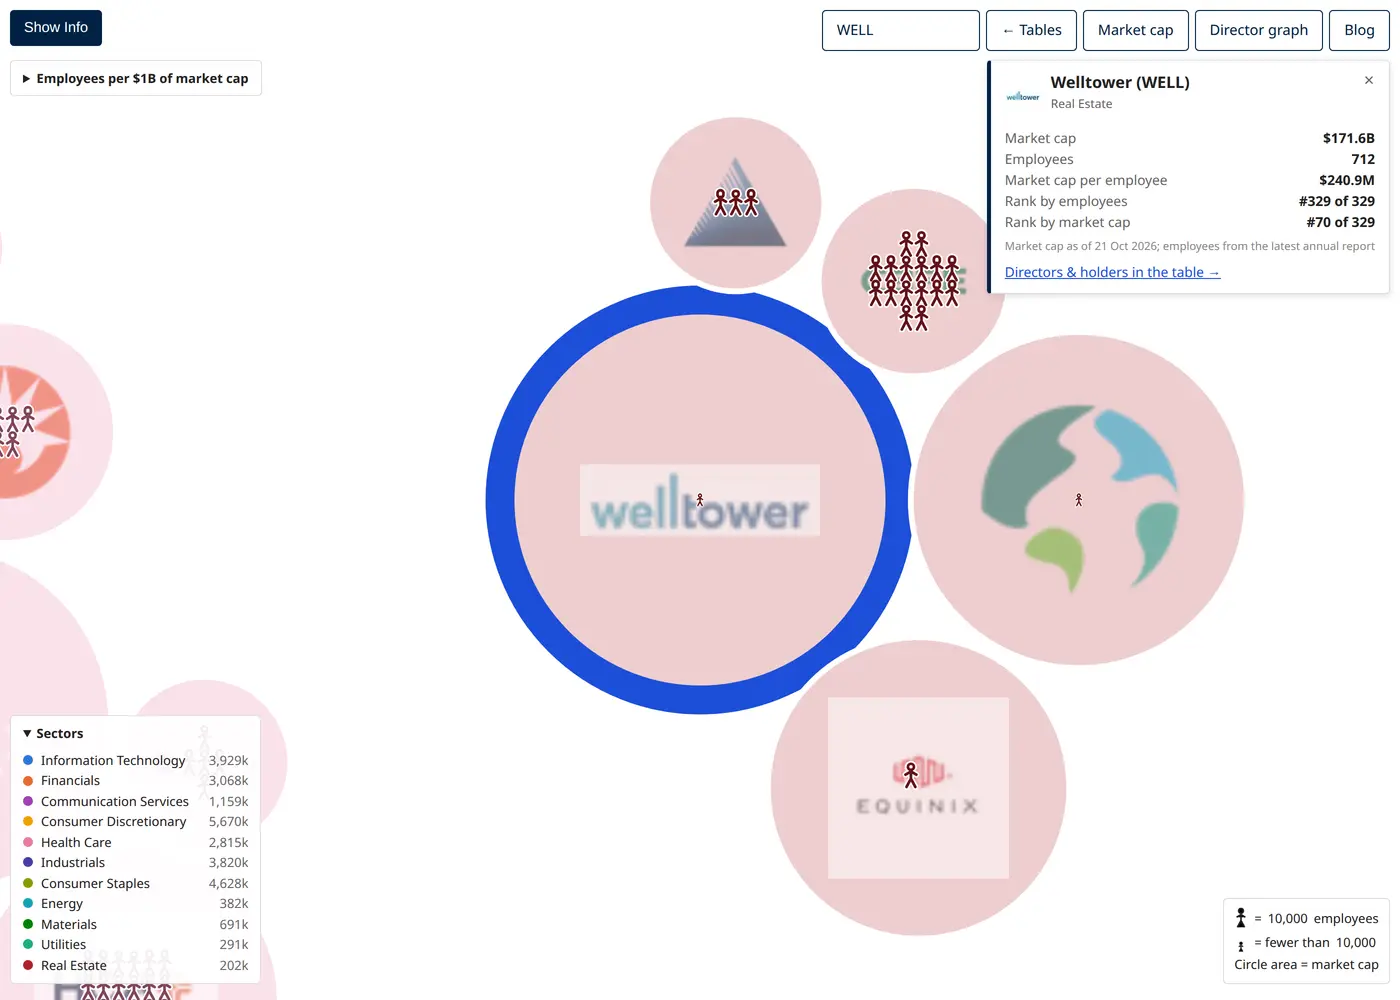
They're a good illustration of why I found the infographic so interesting in the first place.
Accenture: 814,000 employees and a much smaller planet
Now look at Accenture.
Accenture employs 814,000 people. That's more than almost every other company in the S&P 500. Only Walmart, with 2.1 million, and Amazon, with 1.6 million, employ more.
Yet Accenture's market cap is around $146 billion, making it only the 84th most valuable company shown.
Its sphere is absolutely packed with stick figures.
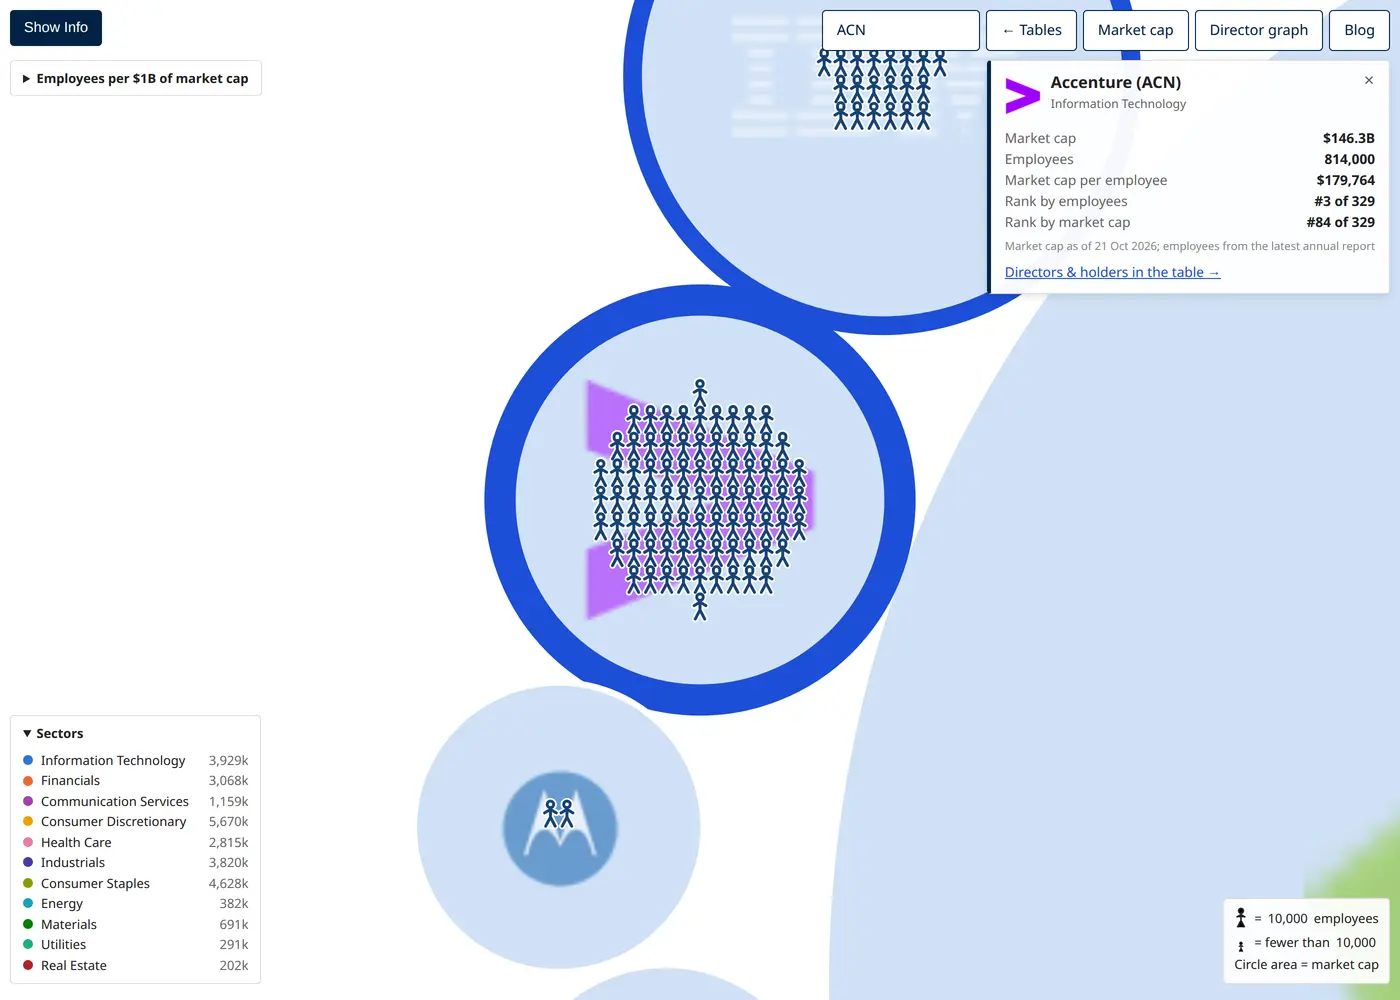
Here's what I find remarkable.
Nvidia and Accenture are both classified as Information Technology companies.
Accenture employs almost 20 times as many people as Nvidia, yet Nvidia is worth about 36 times as much.
Put another way, Accenture has around $180,000 of market cap per employee. Nvidia has roughly $124 million. That's almost 700 times more market value per employee.
Of course, they're very different businesses. Accenture sells consulting and technology services, which depend heavily on people doing the work. Nvidia designs chips and sells technology that can generate enormous revenue without a similarly enormous workforce.
There's also the AI question. If AI can do more of the work that consulting firms currently bill people for, what happens to companies whose business models rely so heavily on human labour?
It's a question investors have been asking as AI changes expectations for the technology services industry.
And Accenture isn't even the most crowded sphere. That honour goes to Cognizant, another IT services company, with 11,061 employees for every $1 billion of market cap.
Compare that with Welltower's roughly four employees per billion dollars. That's a difference of around 2,700 times.
Both companies are in the same stock market index, yet their market values relative to their direct workforces could hardly be more different.
McDonald's: where are all the employees?
Another company that caught my attention was McDonald's.
McDonald's has restaurants everywhere. You'd imagine it employs millions of people.
Yet its sphere contains just 15 figures, representing 150,000 employees, despite being worth around $174 billion.
So where is everyone?
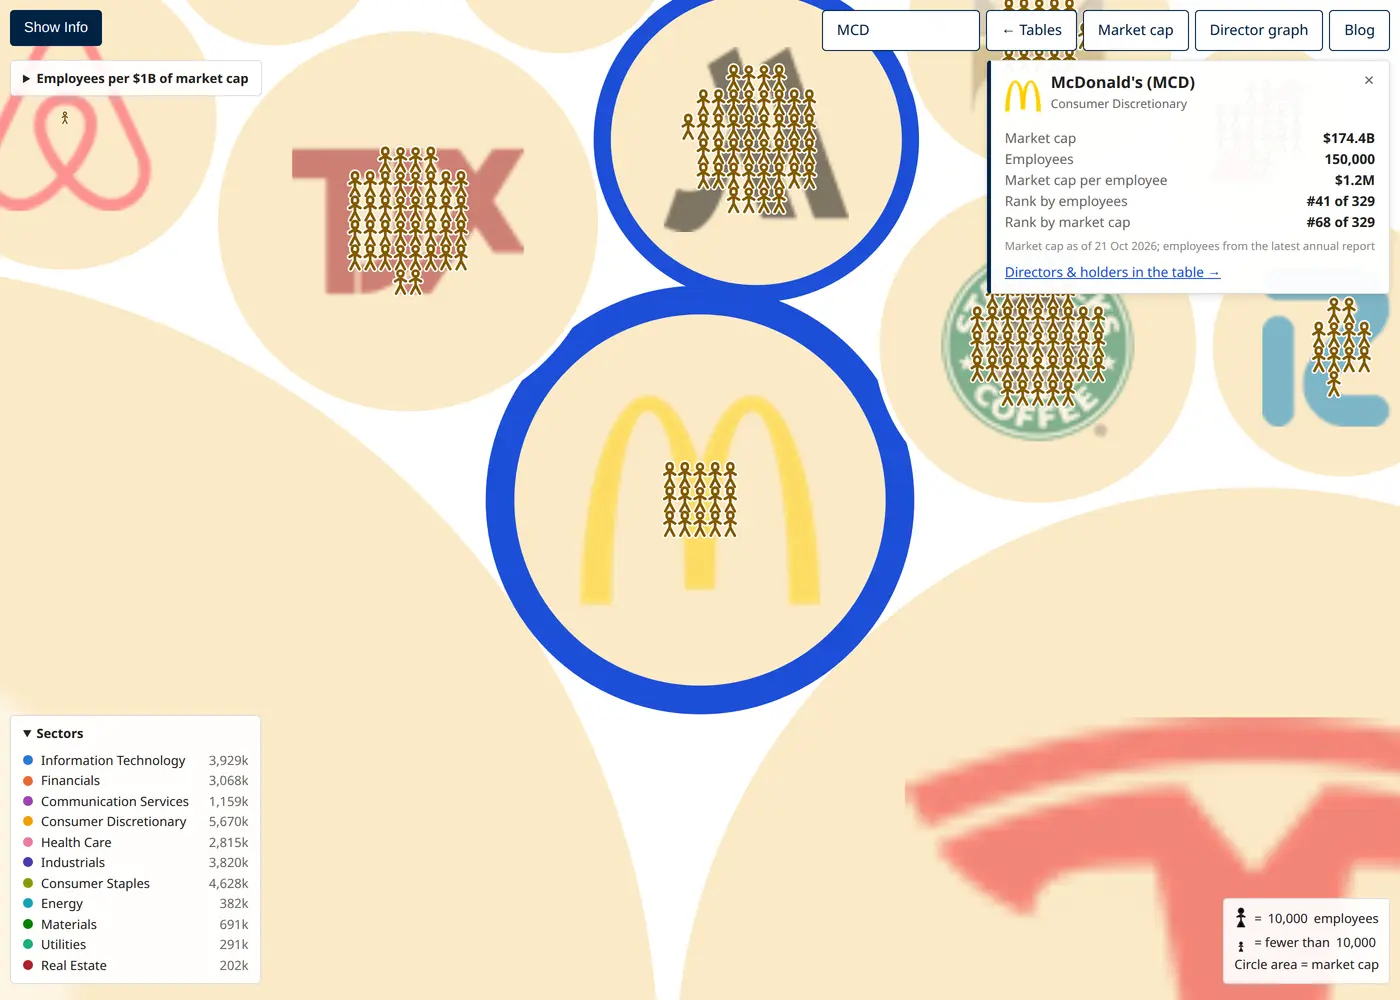
The answer is franchising.
Around 95% of McDonald's restaurants are operated by franchisees. The people working in those restaurants are employed by the franchise owners, not McDonald's Corporation.
If you counted everyone working under the golden arches, you'd get closer to 2 million people.
But McDonald's itself is largely a business that owns valuable brands, licenses them to franchisees and collects rent and royalties.
That also explains why Yum! Brands, which owns KFC, Taco Bell and Pizza Hut, reports just 49,000 employees.
Compare that with Starbucks, which operates most of its own stores and employs 381,000 people, or Darden, which operates Olive Garden and LongHorn Steakhouse and employs 210,000 people despite being worth only around $25 billion.
They're all serving food and drink, but the way their businesses are organised makes an enormous difference to their reported headcounts.
It made me realise there's an important limitation to the infographic. We're only counting employees reported by the companies themselves. Contractors, franchise workers and people employed by suppliers aren't necessarily included.
Apple, for example, doesn't employ the people assembling most of its iPhones. Foxconn does.
So an apparently empty sphere doesn't always mean a company needs very few people to operate.
Some companies didn't make the cut
There are roughly 500 companies in the S&P 500, but my visualisation only shows 329 of them. That's because I had to introduce two filters to make the graphic readable.
First, I generally left out companies with fewer than 10,000 employees, since they wouldn't even have one full stick figure. A handful of big ones are shown with a single half-size figure instead: Welltower and Palantir, as well as Arista Networks, worth $229 billion with just 5,115 employees, Prologis, Marvell, ConocoPhillips, Valero, Vertex, Altria, CME Group and Airbnb. The other 112 are left out.
The second filter removes companies worth less than $20 billion because their spheres were too small to display properly. That excludes employers like Aptiv, with 140,000 workers, and Tyson Foods, with 133,000.
In total, 171 companies are excluded. Between them, they employ roughly 2.6 million people. That leaves approximately 26.6 million employees in the visualisation, out of 29.2 million across the full index.
A few things worth remembering
Before anyone takes the numbers too literally, there are a few limitations.
- Employee counts come from company reports via Yahoo Finance, with Wikipedia used where figures weren't available. They're not necessarily from the same date, and companies don't all count employees in exactly the same way.
- The market caps are from 21 October 2026, while employee figures can be up to a year old.
- The stick figures are rounded to the nearest 10,000 employees, so they're a visual approximation rather than an exact count.
- As the McDonald's and Welltower examples show, a company's reported workforce doesn't necessarily represent everyone whose labour contributes to its business.
- Dual-class companies such as Alphabet, Fox and News Corp are counted only once.
What I found most interesting
When I started adding little people to the market cap spheres, I expected the biggest companies to have the biggest crowds.
Instead, I found a $5.2 trillion company with just 42,000 employees, a $172 billion property company with fewer than a thousand, and a consulting firm employing more than 800,000 people but worth a fraction of either Nvidia or Palantir.
Then there's McDonald's, with millions of people working under its brand but only 150,000 on its own employee count.
It really demonstrates how different companies can be.
Some make their money from intellectual property. Some rely on armies of workers. Others own assets or brands and let completely separate businesses handle much of the labour.
And yet they're all sitting together in the S&P 500, measured by the same thing: their market value.
I think seeing the people inside those valuations makes the differences much more interesting.
Explore the interactive workforce visualisation →
You can zoom into individual companies, search for one you're interested in, or click a sector to see how companies compare.
You can also explore my S&P 500 market cap visualisation, which shows how company valuations have changed week by week since 2008, or read my earlier post on how connected the S&P 500 is through company directors.